
How to Automate VO₂ Max Test Reports: Step-by-Step for Clinics
Automate VO₂ max test reports in under 5 minutes — CSV upload, auto-scoring and branded PDFs with Aerivity's reporting engine. Step-by-step guide.

Manual VO₂ max reporting is the single biggest time drain in a performance clinic. A 45–90 minute report cycle caps how many tests a practitioner can run profitably and delays delivery for clients who paid premium prices for fast, professional results. This guide walks through the exact six-step workflow to compress that to under five minutes using Aerivity.
What a VO₂ max report should include
A complete report covers every metric a clinician or client could reasonably want:
- VO₂ peak (absolute and relative ml/kg/min).
- VO₂ at VT1 and VO₂ at VT2.
- ACSM percentile by age and sex, using the ACSM Guidelines for Exercise Testing and Prescription.
- Fat burn rate across HR / power zones (Frayn equations).
- HR recovery at 1 minute and 2 minutes post-test.
- Resting metabolic rate estimate.
- Fitness age and longevity score (Estimated · Non-diagnostic where relevant).
- Training zone recommendations derived from VT1 / VT2 or % VO₂ peak.
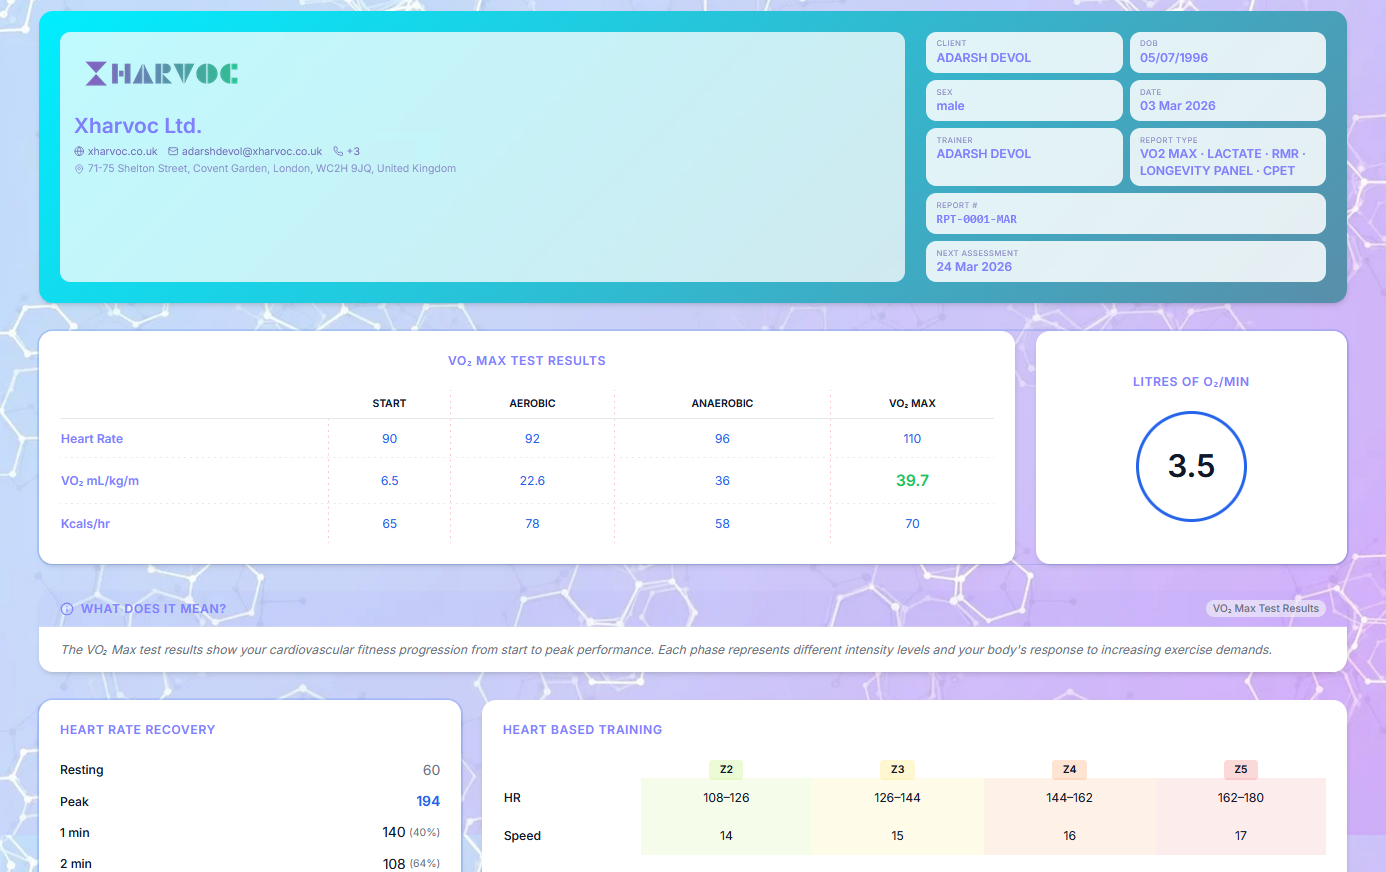
The manual vs automated approach
The manual approach typically involves: copying CSV into a master Excel workbook, running formulas for VT1 and VT2, screenshotting the V-slope chart, pasting it into a Word template, manually typing the client's name, and exporting to PDF. The whole cycle takes 45–90 minutes, often more if the practitioner is new to the template.
The automated approach: upload CSV, click generate. Total time, including a clinical review of the auto-detected thresholds: under five minutes.
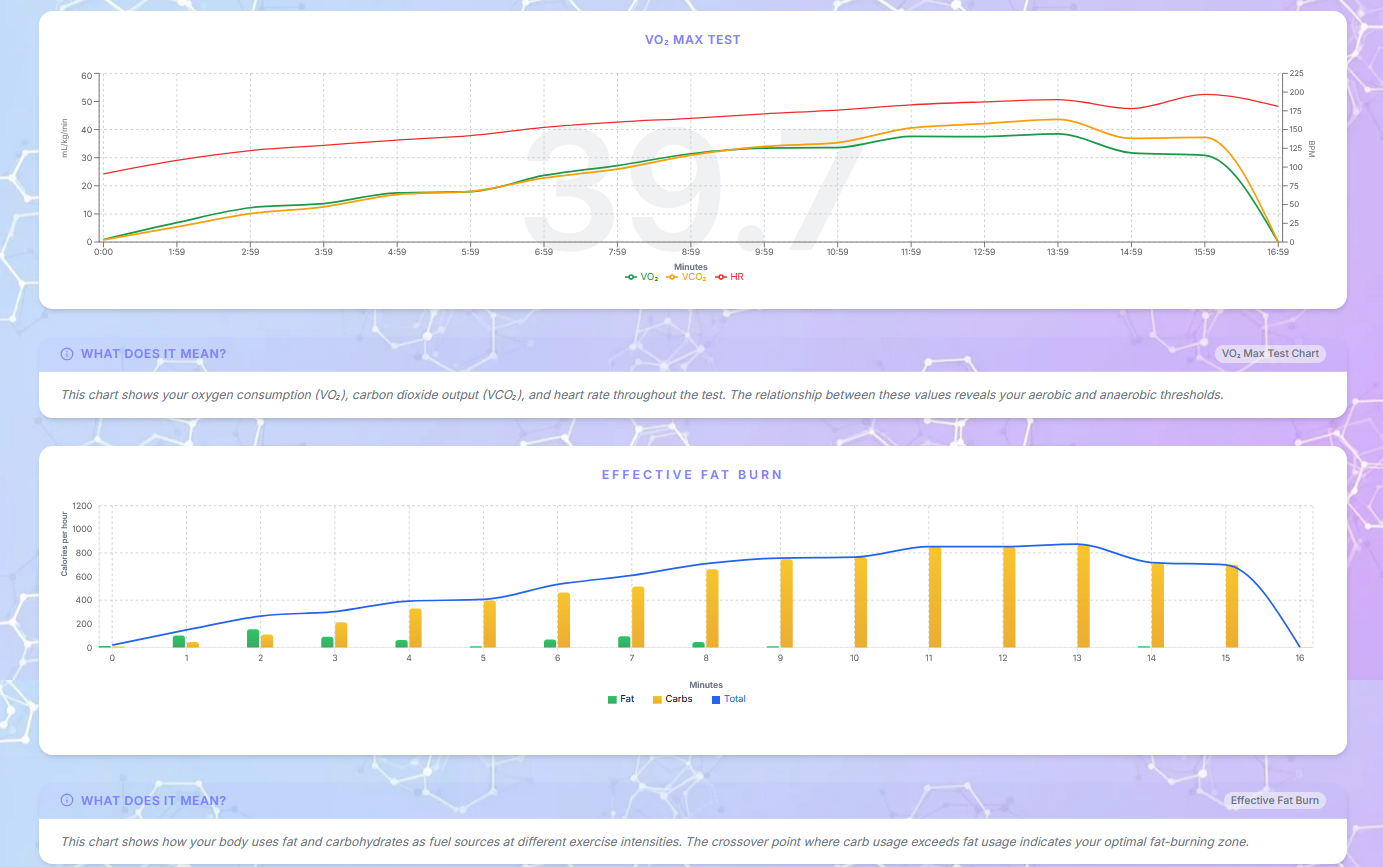
Step-by-step: automating VO₂ reports with Aerivity
Export CSV from your gas analyser
Use your metabolic cart's CSV export. Aerivity accepts breath-by-breath, 10-second average or 30-second average data from any major analyser.
Upload to the client profile in Aerivity
Open the client's profile, click New Test, and drop the CSV. Column mapping is automatic for the major carts and saved for any custom exporter.
Auto-detect VT1, VT2 and VO₂ peak
Aerivity runs V-slope for VT1, ventilatory equivalents for VT2, and a peak-with-verification check for VO₂ peak. Every threshold is editable with a single click.
Review the auto-generated report card
The clinician sees every metric — VO₂ peak, ACSM percentile, fat burn rate, HR recovery, longevity score — on one screen, with raw charts and the override controls in context.
Generate a branded PDF report
One click produces a PDF using your clinic's logo, colours and footer. The same report is published as a mobile-friendly secure web link.
Send directly to the client
Send the report via Aerivity using your clinic's branded SMTP. The client receives an email from your domain, with both the PDF and a shareable link.
Time-savings benchmark
We benchmarked the same VO₂ test against the same practitioner running both workflows. The automated cycle removes every step that doesn't require clinical judgement.
| Step | Manual (Excel + Word) | Aerivity |
|---|---|---|
| CSV cleanup & column mapping | 8 min | 10 sec (saved mapping) |
| VT1 / VT2 detection | 15 min | 30 sec auto + review |
| Fat oxidation curve | 12 min | Auto |
| ACSM percentile lookup | 5 min | Auto |
| Chart export & paste into Word | 20 min | 0 sec (templated) |
| PDF + brand polish | 15 min | 1 click |
| Total | ~75 min | ≈4 min |
What metrics are calculated automatically?
VO₂ peak
Taken as the highest 30-second rolling average during the test, with optional verification phase support to confirm a plateau.
VT1 and VT2
VT1 via V-slope ( Beaver, Wasserman & Whipp, 1986). VT2 via ventilatory equivalents (the crossover of VE/VO₂ and VE/VCO₂). Both thresholds are editable.
Fat burn rate by zone
Frayn equations applied across HR or power zones, plotted as a continuous curve and as a per-zone summary.
HR recovery
Delta HR from peak at 1 min and 2 min post-exercise, with reference bands. An HRR1 of ≤12 bpm has been linked to elevated all-cause mortality in landmark cohort data (Cole et al., NEJM 1999).
Longevity and fitness age
A composite score derived primarily from VO₂ peak and HR recovery, presented as an estimate with a transparent "Explain Score" breakdown so the clinician can answer questions confidently.
Common pitfalls when automating VO₂ workflows
- Trusting auto-detection blindly. Auto-placed thresholds are right ~90% of the time. Always glance at the V-slope chart before signing off — Aerivity surfaces a confidence band exactly for this reason.
- Ignoring the verification phase. A VO₂ peak without a plateau or verification bout is a peak, not a max. Configure your protocol to capture it.
- Reusing one template for every client. Athletes want training zones at the top of the report; longevity clients want bio-age and ACSM percentile. Build two templates, not one.
- Skipping the longitudinal view. The biggest commercial lift is the retest comparison — make sure your software stores test history against a single client profile, not as orphan PDFs.
Can you customise reports by client?
Yes. Aerivity lets you toggle every metric, add free-text clinician notes, attach images, and apply a different template per client profile or organisation. Templates can be saved and reused — for example, one for athletes that highlights training zones, and one for longevity clients that leads with the bio-age estimate (Estimated · Non-diagnostic).
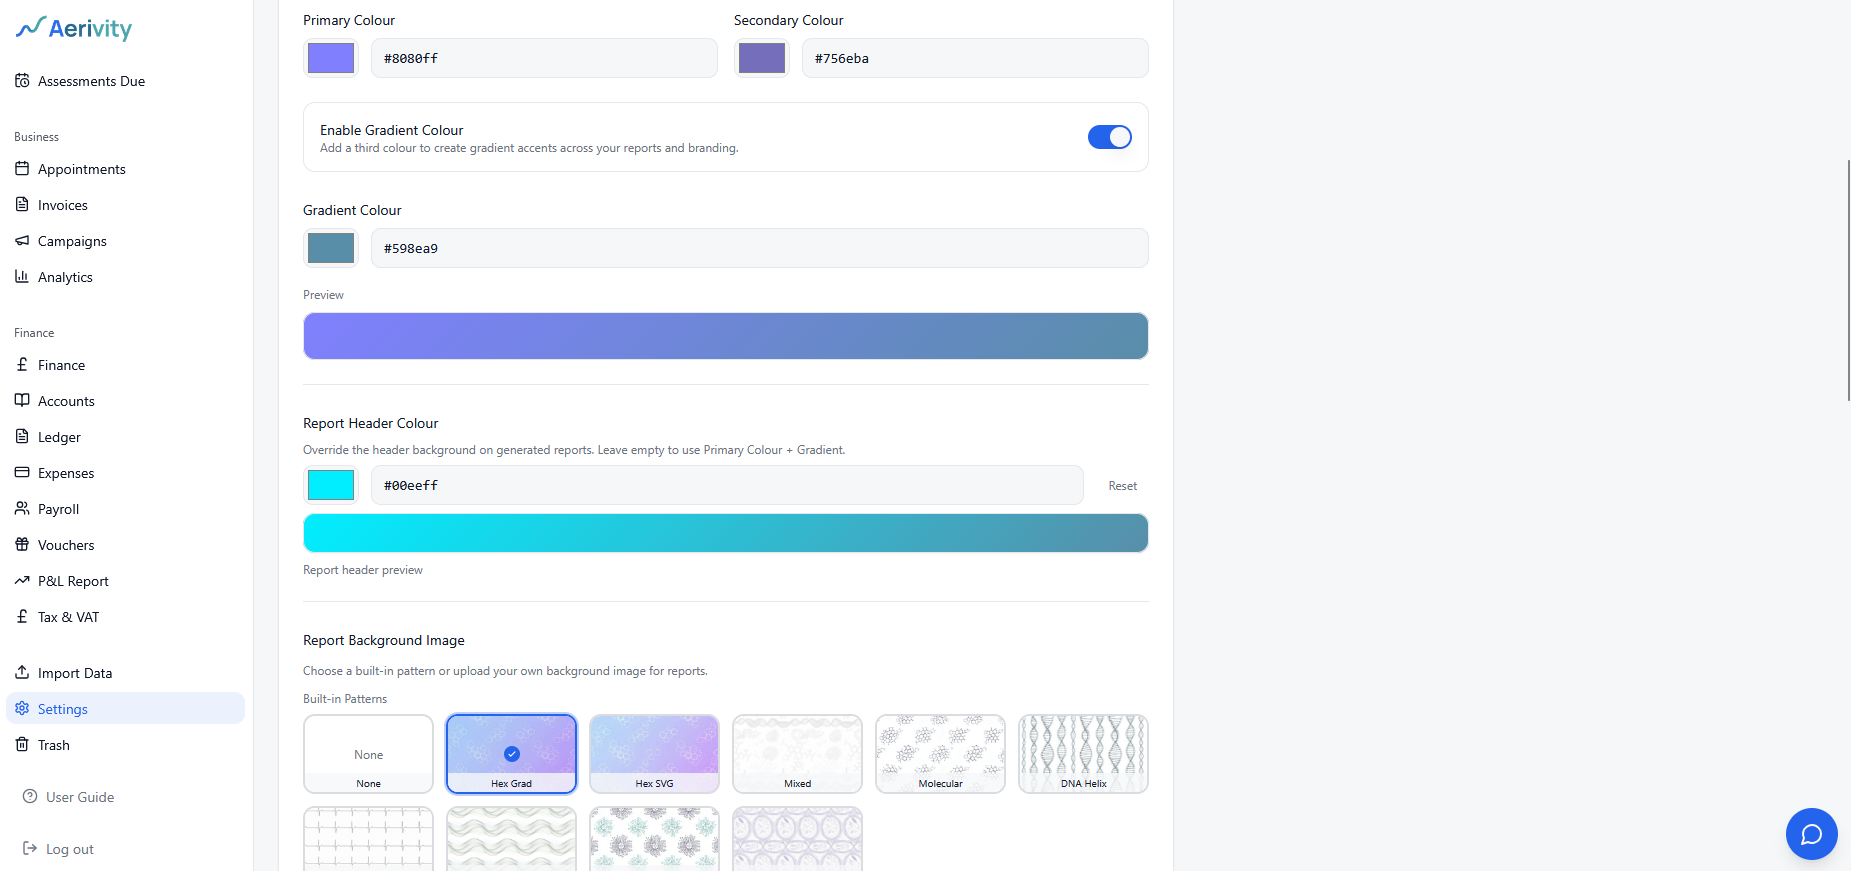
More on the automated reporting cycle
Aerivity is a brand of Xharvoc Ltd, the UK-registered parent company behind the platform. The product page walks through the same CSV-to-branded-PDF pipeline described above. For longer write-ups on report interpretation, clinician overrides and the science behind each metric, see the Aerivity blog on xharvoc.co.uk.
Keep reading
Frequently asked questions
What gas analysers does Aerivity import from?
Can I automate report delivery by email?
How accurate are automated VT1/VT2 calculations?
Can a clinician override an auto-detected threshold?
Ready to modernise your clinic?
Try Aerivity free for 15 days. White-label reports, automated VO₂ analysis, invoicing and client management — all in one platform.
No credit card required.